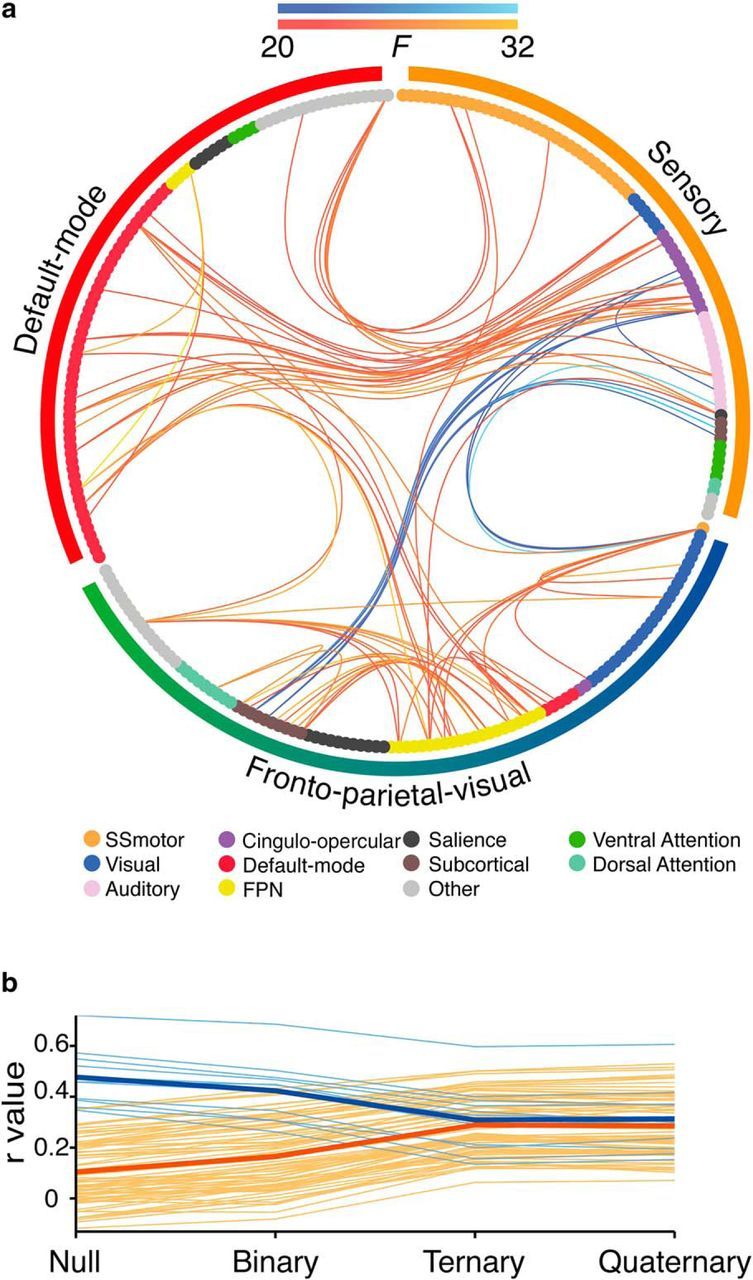
Figure 4.

Change in pairwise functional connectivity associated with reasoning complexity. a, Connectogram representation of significant changes in pairwise functional connectivity that scaled with relational complexity. Edge colors indicate direction of correlation change across relational complexity. Warm colors represent increases in connectivity and cool colors represent decreases in connectivity. Lighter colors represent higher F statistics. Network nodes, plotted as circles, are colored by their initial resting-state networks (Power et al., 2011). Outside the connectogram, the colored bars represent the modules identified in the previous analysis of data from the Quaternary condition: sensory (orange), default-mode (red), and FPV modules (green-blue). b, Each individual connection in the subnetwork (averaged across subjects) plotted as a function of reasoning complexity. Average values for positive and negative connections are shown as bold lines.
