
Figure 5.
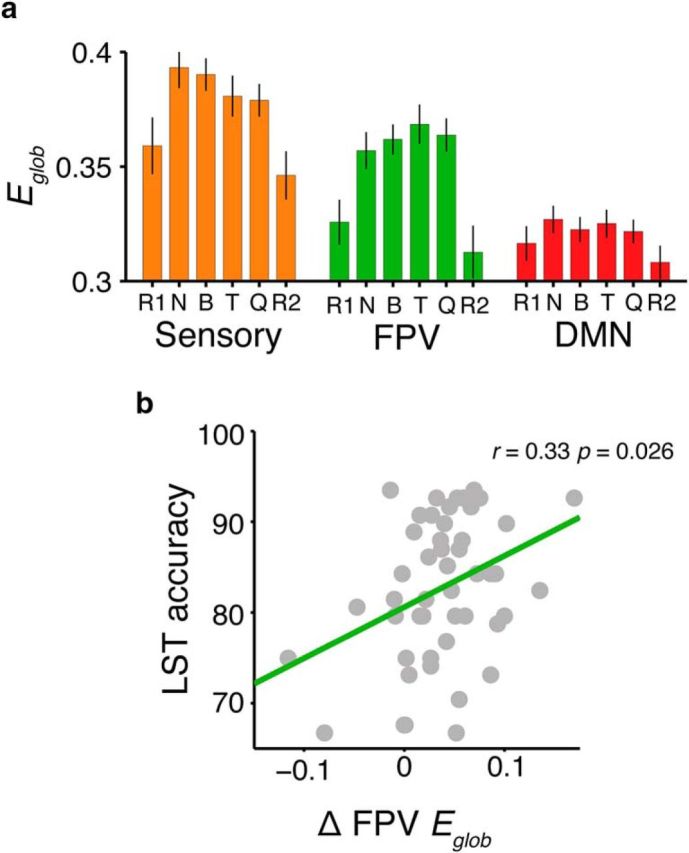
Changes in global network efficiency (Eglob) across the identified reasoning task modules. a, Global network efficiency levels within each module across experiment conditions. Error bars represent 95% confidence intervals. R1, Pre-task rest; B, Binary; T, Ternary; Q, Quaternary; R2, Post-task rest. b, Correlation between accuracy in the LST and changes in FPV module efficiency during the task. Changes in network efficiency were correlated with overall reasoning performance, such that increased efficiency correlated with better task performance (r = 0.33, p < 0.01). Results are visualized at 15% network density.