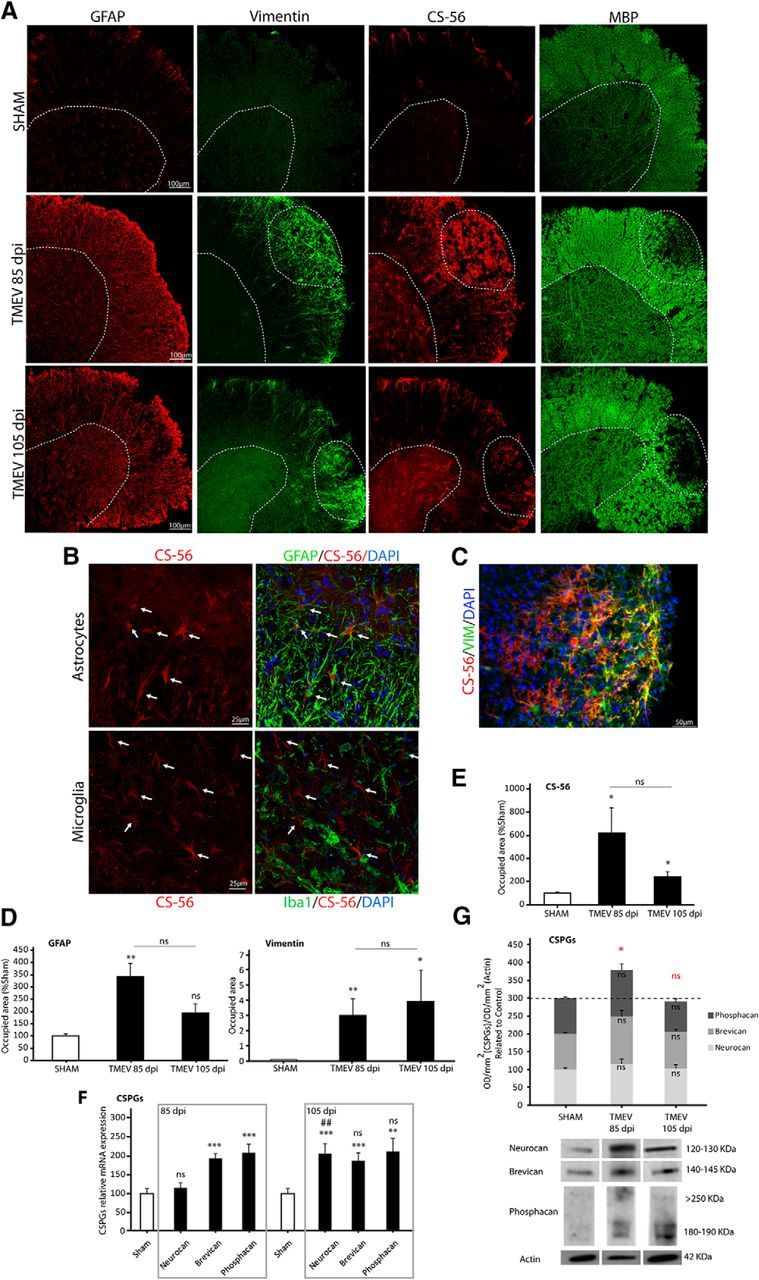
Figure 1.

Astrogliosis is associated with CSPGs accumulation and demyelination in the mouse spinal cord at chronic phases of TMEV infection. Representative microphotographs of spinal cord sections stained for astrocytes (GFAP and vimentin), CSPGs (CS-56), and myelin (MBP) at 85 and 105 dpi (A). CS-56-expressing cells were astrocytes (GFAP+, vimentin+) and did not colocalize with microglial cells (Iba-1−) (B, C). Astrogliosis is evident in TMEV-infected mice (GFAP and vimentin staining) (D) and is accompanied by increased CS-56 staining (E), and by gene expression of neurocan, brevican, and phosphacan (F). CSPGs analyzed together in a joint manner by Western blot revealed an increment of these molecules at 85dpi (G). Data indicate mean ± SEM. ***p ≤ 0.001 versus sham. **p ≤ 0.01 versus sham. *p ≤ 0.05 versus sham. ##p ≤ 0.01 versus TMEV 85 dpi. Red statistical significances correspond to comparisons between joint CSPGs analysis. Nonparametric Kruskal–Wallis test for vimentin, CS-56 staining, and phosphacan RT-PCR analysis (one-way ANOVA followed by Tukey's and Bonferroni's test for GFAP staining, neurocan, brevican RT-PCR analysis, and CSPGs Western blot analysis). Five to 8 mice per group were used for histological analysis. Eight to 11 animals per group were used for mRNA expression analysis. Eight to 11 per group were used for Western blot analysis. Scale bar, 100 μm, 50 μm, 25 μm. Dotted lines indicate spinal cord gray matter and demyelinated areas. Arrows point to microglia and astrocytes.
