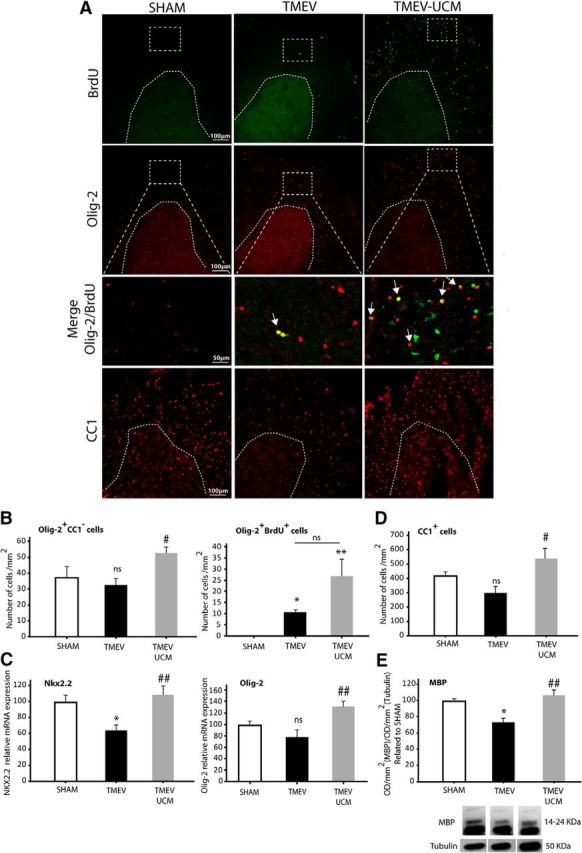
Figure 4.

UCM03025 increased the expression of OPC markers, Olig-2+ proliferative cells, mature CC1+ oligodendrocytes, and myelin markers in the spinal cord of TMEV-infected mice. Representative microphotographs of cervical spinal cord sections obtained at 85 dpi and stained for BrdU, OPCs (Olig-2), and mature oligodendrocytes (CC1) (A). UCM03025 increased the number of Olig-2+/CC1−-labeled cells and tended to increase their proliferation (Olig-2+/BrdU+ cells) (B). UCM03025 significantly increased gene expression of OPC markers (Olig-2 and Nkx2.2) (C), augmented the number of CC1+ mature oligodendrocytes (D), and MBP analyzed by Western blot (E). Data are mean ± SEM. *p ≤ 0.05 versus sham; **p < 0.01 versus sham. #p < 0.05 versus TMEV. ##p < 0.01 versus TMEV. Nonparametric Kruskal–Wallis test for BrdU+/Olig-2+ cell quantification and MBP Western blot analysis; one-way ANOVA followed by Tukey's and Bonferroni's test for RT-PCR analysis, CC1-labeled cells, and Olig2+/CC1− quantification. Three or 4 animals per group were used for histological analysis. Five or 6 animals per group were used for mRNA expression analysis; 5 or 6 mice per group were used for Western blot analysis. Scale bar, 100 μm, 50 μm. Dotted lines indicate spinal cord gray matter and amplified areas. Arrows point to Olig-2+/BrdU+ cells.
