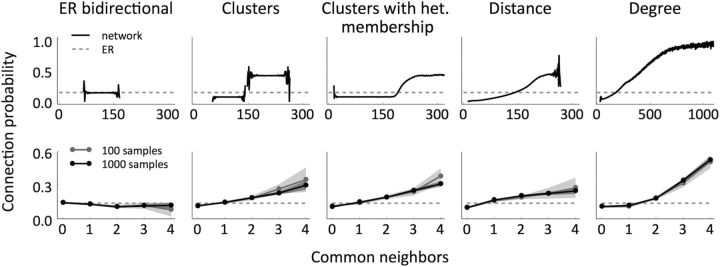
Figure 3.
Connection probability as a function of the number of common neighbors for the different models, in the whole network (top) and in samples of size 12 (bottom). In all the cases, N = 2000, p = 0.14, R = 2. The analyses were performed on five networks and the shaded regions indicate the resulting mean ± SEM. In the sample analyses, we took 20 samples per network (100 in total, gray) and 200 samples per network (1000 in total, black). The dotted lines show the expected probability if it were independent of the number of common neighbors, as in the ER and ER-Bi models.

