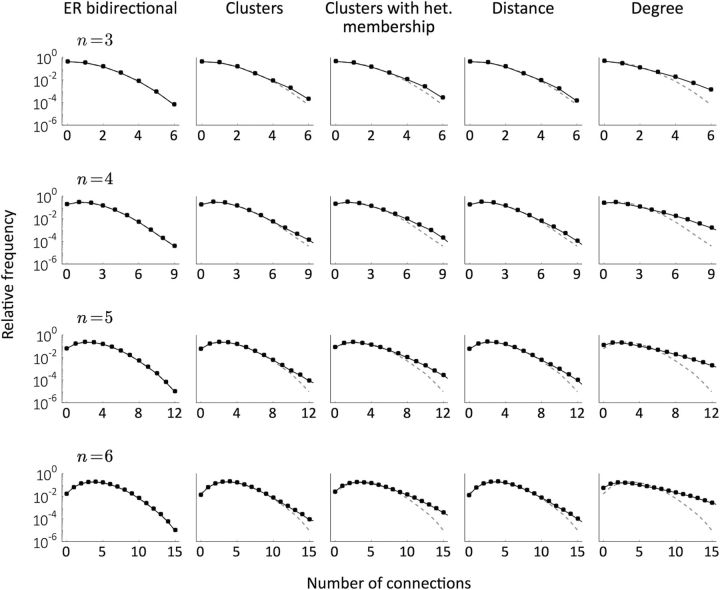
Figure 5.
Distribution of the total number of connections in samples of sizes n ∈ {3, … ,6} for the different models (black) compared with the distribution obtained in ER bidirectional networks with the same p and R (dashed gray). The parameters are the same as in Figures 3 and 4. The analyses were performed on five networks per condition and the computations come from 105 random samples for each network.

