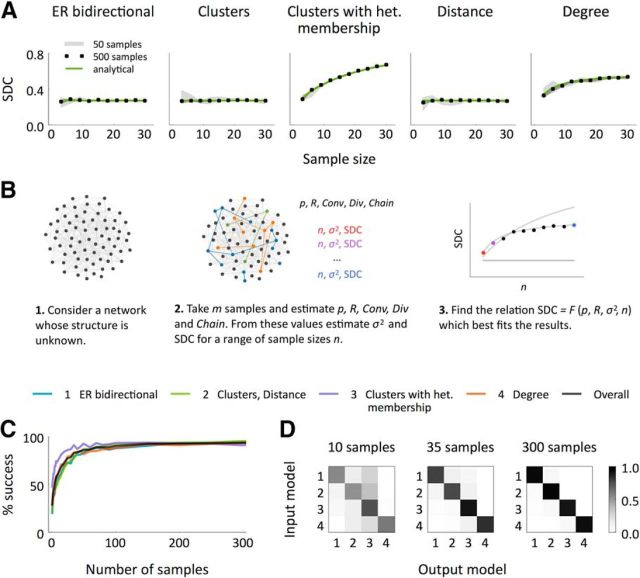
Figure 6.
Sample in-/out-degree correlation (SDC) as a measure to distinguish between classes of networks. A, SDC in samples of 3 to 30 neurons in the different models. In all the networks, N = 2000, p = 0.12, R = 3. We computed the empirical correlations using 50 and 500 samples per network for each sample size. Every analysis was performed independently in five different networks and the shaded region indicates the resulting mean ± SEM. B, Schematic representation of the algorithm proposed to distinguish between the model classes: (1) ER-Bi, (2) Cl/Dis, (3) Cl-Het, and (4) Deg. C, Success rate of the algorithm performed on randomly generated networks with N = 2000, p ∈ [0.05, 0.23], R ∈ [1.5, 4.1] as a function of the number of samples considered m. All the samples had size n′ = 12. Each success rate was computed over 2000 experiments. D Frequencies of all the possible input–output combinations in the experiments shown in C for three choices of the number of analyzed samples. Each frequency is normalized by the frequency of the input model so that the sum of every row is 1.

