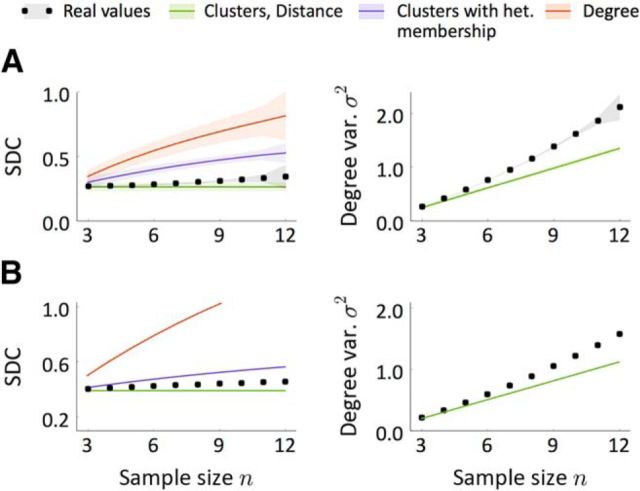
Figure 7.
Sample in-/out-degree correlation SDC and geometric mean of the sample degree variances σ2 as a function of the sample size n. A, Values calculated directly from the data of Perin et al. (2011). B, Inferred values from the motif counts presented in Song et al. (2005). The black curves correspond to the observed SDC and σ2, whereas colors show the expected SDC (σ2) in networks generated according to the studied models with the same p, R, σ2 (p, R) as in the data. Shaded regions in A indicate mean ± SEM computed with the bootstrap method.

