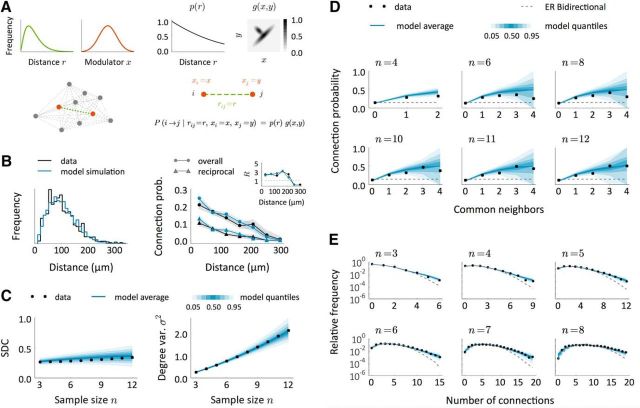
Figure 9.
A modulator network model to reproduce connectivity data from (Perin et al., 2011). A, Schematic of a model to explain the observed data. First, neurons are arranged in space so that distances between neuronal pairs follow a given distribution (green). Each neuron has also an associated modulator whose distribution is shown in red. Given a distance-decaying probability p(r) and a function g = g(x, y), connections are created independently with probability P(i → j|rij = r, xi = x, xj = y) = p(r)g(x, y). B, Intersomatic distance distribution and connection probabilities as a function of distance in the data (black) and in the model (blue). Inset, Number of reciprocal connections relative to random R as a function of distance. The model results come from a single replica of the real experiment and shaded regions indicate mean ± SEM. C, SDC and geometric mean of the sample degree variances σ2 as a function of sample size n in the data (black) and in the model (blue). The blue-shaded regions indicate quantiles computed from a set of 200 replicas of the real experiment, each performed on an independent network. D, E, Comparison between model and data in terms of the common neighbor rule (D) and the distribution of the total number of connections (E) in samples of size n. Dashed lines show the prediction for the ER-Bi networks.

