
Fig. 1.
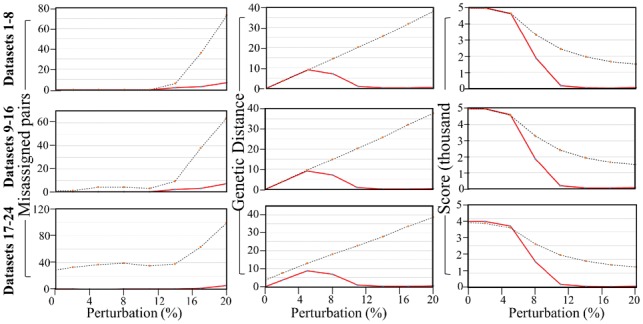
PaMsimple performances on simulated datasets. Rows show the results of eight perturbed datasets [full dataset (left), remove-1 (centre) and remove-20 (right)]. PaMsimple was applied without a threshold (dashed) and with a threshold of 7 (solid red). Columns show the number of individuals assigned to a different pair than their original counterpart per dataset (x-axis), total GD between all matched pairs and total score (maximum of 10 per pair with the three datasets having n1 = 500, n2 = 499, and n3 = 480 pairs, respectively)