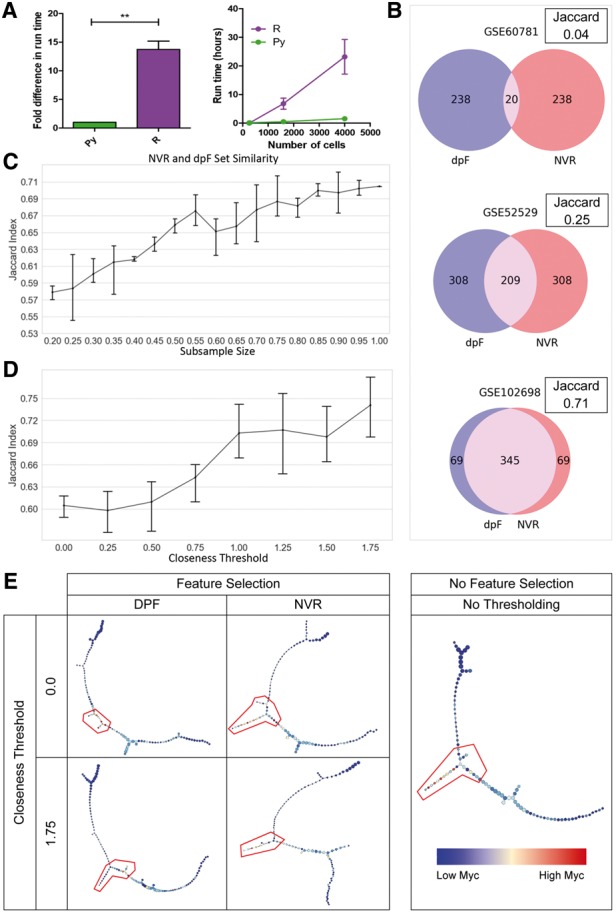
Fig. 1.

Evaluation of pyNVR performance. (A) Fold difference in runtime between the Python and R implementations of NVR. (B) Gene set similarity given different datasets. (C) Gene set similarity and its relationship with cell number. (D) Gene set similarity and its relationship with closeness threshold-imposed sampling. (E) Representative p-Creode graphs generated using genes selected from closeness-thresholded samples. Heatmap overlay and gating depicts Myc and putative stem-like cell states, respectively
