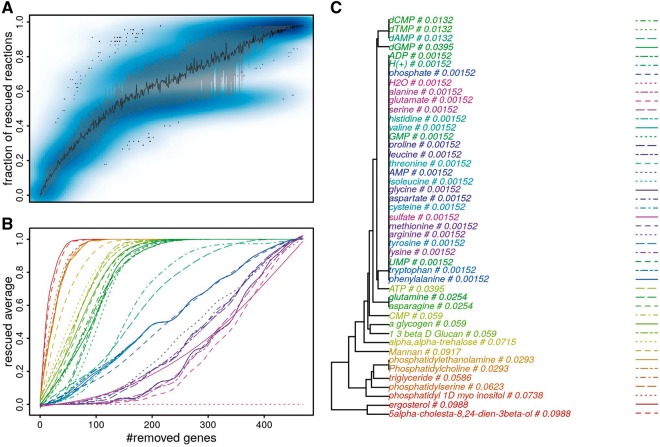
Fig. 2.
Rescue in metabolic sub-models obtained by removing different numbers of random genes (N=50 draws) from Y. lipolytica model iMK735. (A) Fraction of metabolites that need to be rescued via corresponding rescue reactions. Blue darkness in the scatter plot represents the density of fractions of rescued reactions. Black curve indicates average fractions. Gray region represents 20–80% quantiles of random fractions. (B) Fraction of draws where each individual metabolite is rescued. (C) Weights of rescue reactions obtained via our weighting schema

