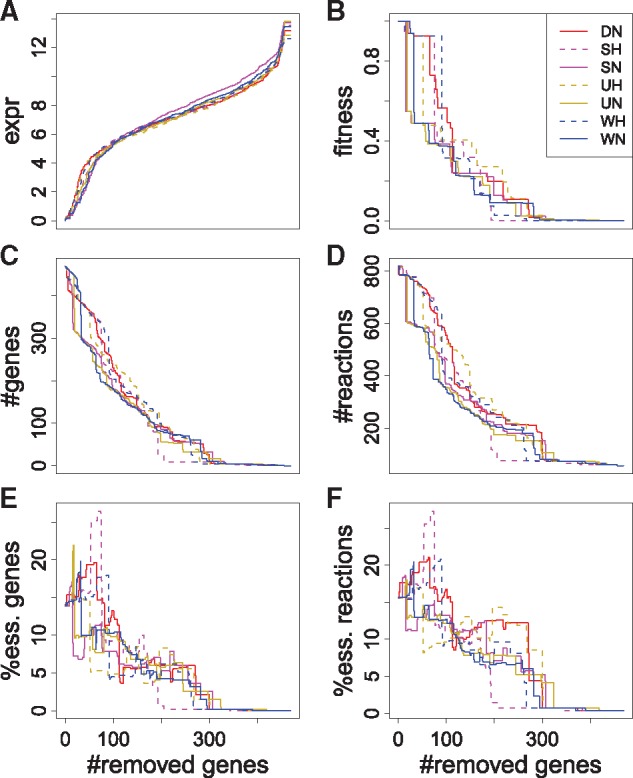
Fig. 6.

Gene expression (A), fitness (B), number of genes (C), number of reactions (D), percentage of essential genes (E) and percentage of essential reactions (F) of Y. lipolytica sub-models from seven RNA-seq conditions, obtained by removing genes following the expr ranking. Only one replicate from each condition is shown. The percentages represent the numbers of essential reactions or genes in sub-models over the total number of those in the comprehensive model
