Figure 1.
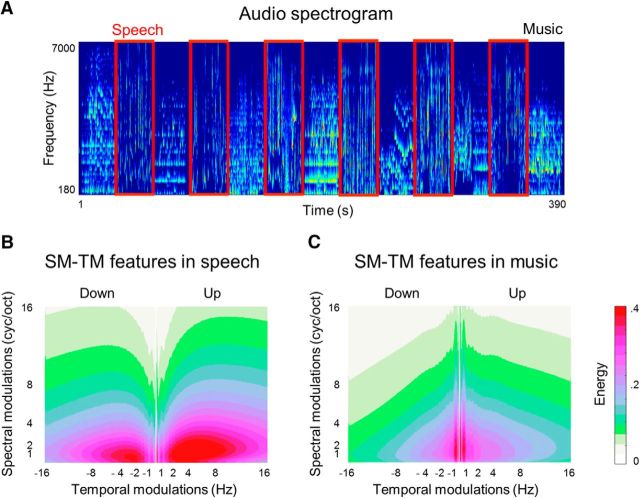
Low-level properties of sound. A, Audio spectrogram of the soundtrack of the 6.5 min video stimulus. Horizontal axis represents time and vertical axis represents frequency scale. The spectrogram was obtained using NSL toolbox at 8 ms windows (sampling rate = 125 Hz). The frequency bins are spaced logarithmically (128 bins) in the range of 180–7000 Hz. Speech blocks are framed in red. Music blocks are the rest. B, Low-level spectrotemporal (SM–TM) features of speech. Horizontal axis represents TMs measured in Hertz; vertical axis represents SMs measured in cycles per octave (cyc/oct). The features were extracted using the NSL toolbox by convolving the spectrogram with a bank of 2D Gabor filters at different spatial frequencies and orientations. The SM–TM features were extracted for every time point and every frequency bin. TMs were obtained at 0.25–16 Hz, in linear steps of 0.2 Hz. SMs were obtained at 0.25–16 cyc/oct in linear steps of 0.2 cyc/oct. Positive and negative sign representations along the TM axis capture the direction of energy sweeps in the spectrogram (up and down). The extracted SM–TM features were averaged over time points within block and across blocks. C, Low-level SM–TM features of music. The feature extraction and visual representation are identical to the SM–TM features of speech in B.

