Figure 3.
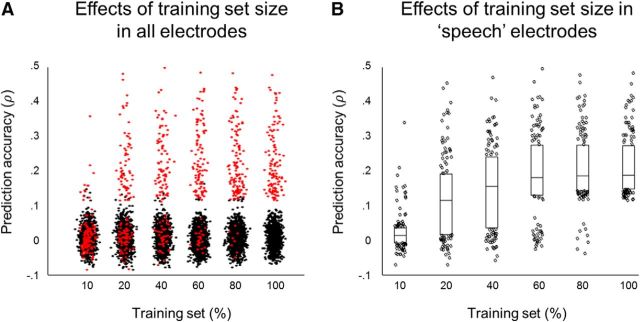
Effects of training size on model performance when tested on speech in ECoG. A, Dot plot of prediction accuracy in all electrodes (N = 1283). Red dots indicate electrodes with significant model performance when trained on 100% training data and tested on speech (130 electrodes). Black plots are remaining electrodes. B, Box plots of prediction accuracy in 130 electrodes with significant model performance when trained on 100% training data and tested on speech. The lower and upper boundaries of the box plots show 25th and 75th quantile, respectively. The horizontal bars show the median. The dots are the remaining accuracy values. One-way ANOVA results showed significant difference between results obtained with 10% training data and all other groups. No significant difference in prediction accuracy was revealed between results obtained with 60%, 80%, or 100% of all training data.

