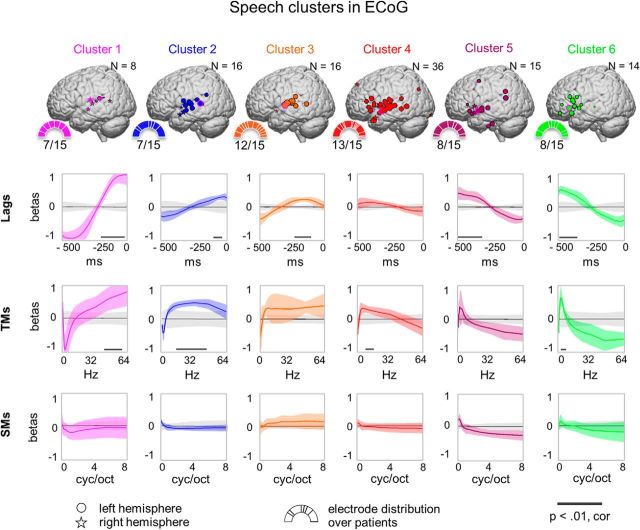
Figure 5.
Affinity propagation clustering of regression coefficients in ECoG electrodes tuned to speech. Shown are six clusters produced by clustering on regression coefficients of electrodes involved in speech tuning. For each cluster, a number of properties are shown: the number of electrodes belonging to the cluster (N), the normalized electrode locations on the MNI brain, the distribution of electrodes over patients (half pie charts with number of patients out of 15), and the feature tuning profiles over lags, TMs, and SMs. Right hemisphere electrodes were projected on the left hemisphere and marked with star symbols; circles show left hemisphere electrodes. The size of electrodes on the MNI brain reflects the similarity of the electrode's feature tuning profile to the exemplar electrode of the cluster (framed in pink). The sectors of the half pie charts show percentage of each patient's electrodes relative to the overall number of electrodes in the cluster (N). The lags were used in the range of 0 to −500 ms with respect to audio onset; TMs were in the range of 0.25–64 Hz; SMs were in the range of 0.03–8 cyc/oct. Per cluster, mean (colored bold curve) and SD (colored shading) over regression coefficients are plotted for each dimension. The mean (gray bold curve) and SD (gray shading) of the null distribution based on permutations of cluster assignments are shown. The black thick line at the bottom of several plots represents significant segments of the tuning profile compared with the null distribution (p < 0.01, Bonferroni corrected).

