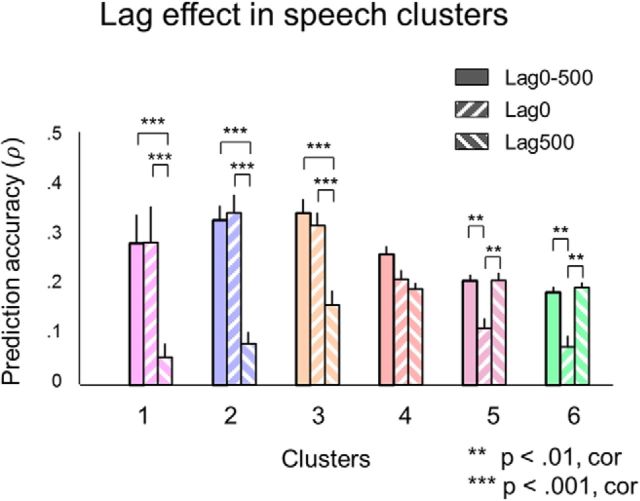
Figure 6.
Lag effects in encoding of speech in ECoG responses. In addition to the full model using all lags from 0 to −500 ms of the audio features to predict ECoG responses (Lag0–500), two more models with reduced lag representation were trained. The first additional model included no lags at all (Lag0) and the second additional model only included one lag at −500 ms (Lag500). The bars show mean prediction accuracy over all electrodes in the cluster. The error bars indicate SEM. A two-way ANOVA test with unbalanced design was performed to estimate the main effect of the lag factor and the interaction between the lag factor and cluster assignment (on 105 electrodes). Groups with significantly different means are shown at p < 0.01 and p < 0.001. The p-values were corrected for multiple comparisons using Fisher's least significance difference under the condition that the null hypothesis had been rejected: F(10) = 10.32, p = 6.06 × 10⁻¹⁵.

