Figure 7.
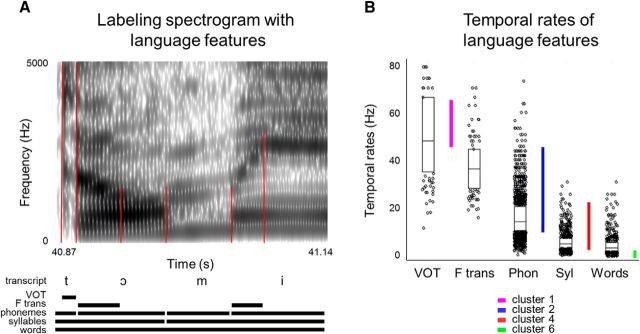
Rates of various language features. A, Details of annotating the spectrogram with the language features. Based on the spectrogram, we identified the boundaries for formant transitions, voice onset time, phonemes, syllables, and words. Red lines outline the acoustic features based on which the annotations were made; for example, here: noise before the voicing of the vowel, changes in the second formant of the vowel, and boundaries between different formant structures of the vowels and a sonar consonant. B, Distributions of rates for each language unit in Hertz: VOT (voice onset time), F trans (formant transitions), Phon (phonemes), Syl (syllables), and Words. The rates were calculated based on the duration of each instance of each language feature. The durations were then expressed in Hertz. The lower and upper boundaries of the box plots show 25th and 75th quantile, respectively. The horizontal bars show the median. The dots are the remaining rate values. Colored vertical bars show TM tuning profiles for clusters 2, 4, and 6.

