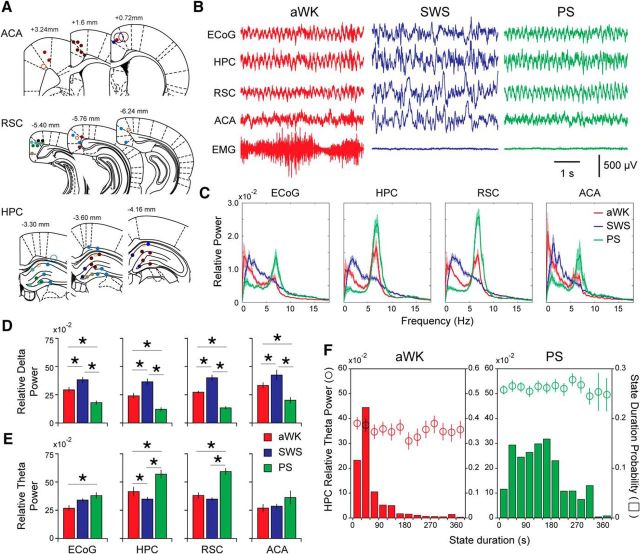
Figure 1.
Analysis of LFPs and ECoG reveals increased theta power in the RSC during PS. A, Schematic coronal sections from the Paxinos and Watson (1997) atlas showing electrode locations in all animals. Anterio-posterior localizations related to bregma are shown above each drawing. B, Representative LFPs recorded in HPC, RSC, and ACA during aWK, SWS, and PS. Together with ECoG and EMG, these recordings were used to score the sleep–wake cycle and to generate the hypnograms. C, Grand-average power spectral density for each state in ECoG, HPC, RSC, and ACA. Note the presence of theta oscillation (∼7 Hz) during PS, and to a lesser extent, during aWK. D, E, Quantification of delta (D) and (E) theta power in each structure. Note the significant increase in theta power in HPC and RSC during PS compared with the other states. *p < 0.05, paired t test. F, Grand-average relative theta power during aWK (left) and PS (right) binned according to the state duration (30 s bins). Note that relative theta power is not influenced by state duration.

