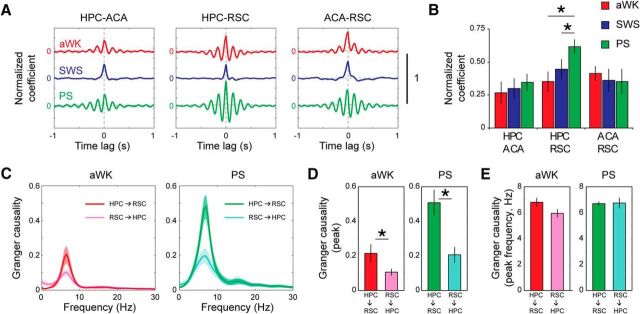
Figure 2.
Increased synchrony in the theta frequency band and asymmetrical directionality between HPC-RSC during PS. A, Mean normalized cross-correlations between pairs of recordings from HPC, RSC, and ACA during aWK, SWS, and PS. B, Averaged cross-correlation coefficients at lag close to zero shows significantly increased synchronization between HPC and RSC specifically during PS. C, Averaged Granger causality spectra between HPC and RSC during aWK (left) and PS (right) shows significant bidirectional interactions in the theta range. Mean and SEM are represented as thick lines and shaded areas. D, Peak Granger causality values and (E) peak frequency in the theta frequency range demonstrate stronger interaction in HPC→RSC than RSC→HPC direction, mainly during PS. *p < 0.05, paired t test (n = 6 for HPC-ACA and ACA-RSC; n = 10 for HPC-RSC).

