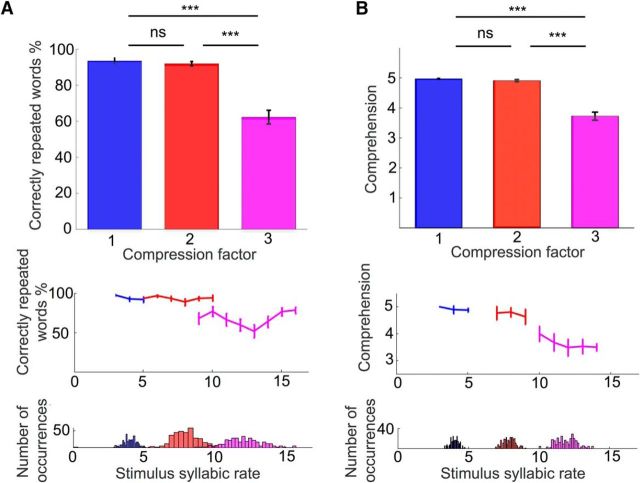
Figure 2.
Behavioral results. A, Behavioral task. Mean percentage of correctly reported words as a function of compression factor in the behavioral task. B, Behavioral task during EEG recording. Mean comprehension ratings given by subjects to the sentences presented during the EEG recording. Left and right middle panels respectively represent the mean performance and comprehension ratings plotted as a function of the average syllabic rate. Bottom panels represent the number of occurrences of each syllabic rate for each task. Error bars indicate SEM. ***p < 0.001. n.s., Nonsignificant.

