Figure 3.
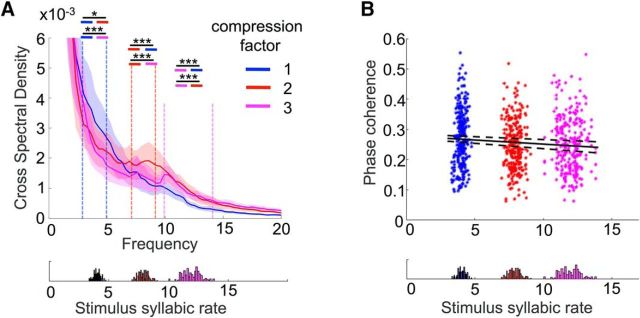
Linking the acoustic and the EEG data. A, Cerebroacoustic CSD. Cross-spectral density values computed for each pair of acoustic stimuli and simultaneously recorded EEG data, for a frequency range from 1 to 20 Hz. The shaded areas correspond to the SEM, computed across participants. Dashed lines delimit the frequency ranges of interest, which for each compression factor correspond to its syllabic rates. Colored lines within each frequency range indicate the comparison of CSD values between the corresponding condition and the other two. B, Phase coherence. Mean phase coherence value between the acoustic and EEG data at stimuli-averaged syllabic rates. Data from all subjects are plotted. The fitted line corresponds to the average of the fitted polynomials of degree 1 and dashed lines correspond to 1 SD of the same polynomials, divided by the square root of the sample size. Bottom panels represent the number of occurrences of each syllabic rate for each task. *p < 0.05, ***p < 0.001. n.s., Nonsignificant.

