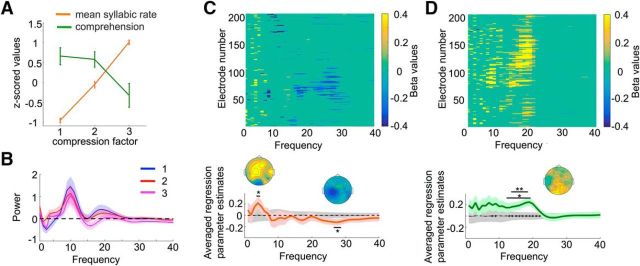
Figure 4.
GLM on EEG power. A, Regressors. Regressors used in the GLM, namely mean syllable rate and comprehension scores, expressed in z-scores averaged across subjects. Error bars represent SEM. B, EEG power. Average power spectra of the EEG data for each compression factor, computed for frequencies between 1 and 40 Hz. Shaded areas correspond to the SEM, computed across participants. C, Mean syllabic rate. Electrodes showing a significant effect for mean syllable rate as a function of frequency. D, Comprehension. Electrodes showing a significant effect for comprehension, as a function of frequency. Effects are shown at p < 0.05, without correction for multiple comparisons for displaying purposes. The bottom plots in C and D represent the estimated regression parameters averaged across all electrodes for mean syllable rate and comprehension, respectively. Shaded areas indicate SEM. *p < 0.05, ***p < 0.001. The dashed black line corresponds to the averaged betas estimated through 1000 permutations and the shaded gray areas represent the SEM of the parameters estimates generated by permuting the data. Black stars on the dashed line in D, bottom plot, correspond to the frequencies where the estimated regression parameters for syllable rate and comprehension significantly differ from each other. Scalp topographies of the estimated parameters are shown for each significant effect.

