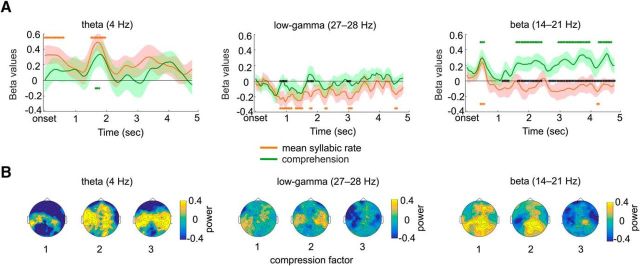
Figure 5.
Time course of the effects of syllable rate and comprehension. A, Regressions time courses. Time course of the estimated regression parameters averaged in the θ (4 Hz; left), low-γ (27–28 Hz; middle), and β (14–21 Hz; right) frequency bands. The shaded areas correspond to SEM. Orange and green stars denote the time windows of significance (p < 0.05) for mean syllable rate and comprehension regression parameters, respectively, and black stars denote the time windows where the estimated regression parameters significantly differ from each other (cluster-corrected for multiple comparisons, using 1000 permutations). B, Power topographies. Scalp topographies of the power in θ (left), γ (middle), and β (right), averaged across the whole peristimulus epoch for each compression factor.

