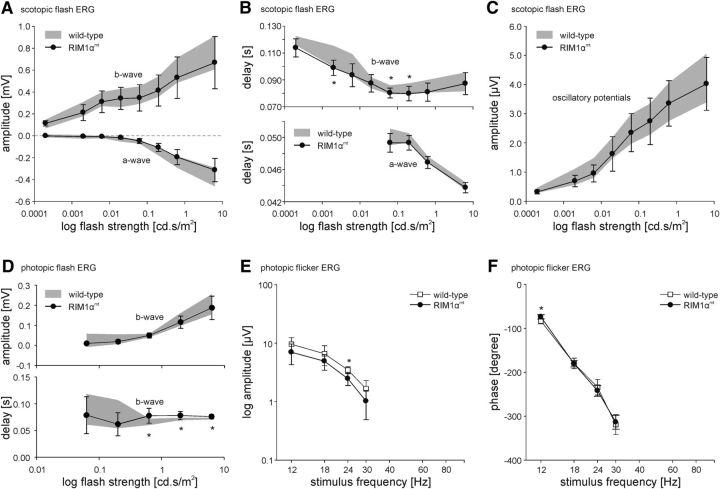
Figure 3.
Scotopic and photopic flash and photopic flicker ERGs of wild-type and RIM1αmt mice. A, Averaged amplitudes of the scotopic a- and b-wave (mean ± SD) of wild-type (range in gray) and RIM1αmt mice (black circles) as a function of stimulus intensity. The a-wave is shown as negative values. B, Averaged delays (mean ± SD) of scotopic a- and b-wave of wild-type (range in gray) and RIM1αmt mice (black circles) as a function of flash strength. a-wave delay is only shown for flash intensities where the recordings exhibit a noticeable a-wave. C, Averaged amplitude (mean ± SD) of the OPs of the scotopic flash ERG of wild-type (range in gray) and RIM1αmt mice (black circles) as a function of stimulus intensity. D, Averaged amplitude and delay (mean ± SD) of the photopic b-wave of wild-type (range in gray) and RIM1αmt mice (black circles) as a function of flash strength. E, Averaged amplitudes (mean ± SD) of the fundamental's amplitude of the photopic flicker ERG of wild-type (white squares) and RIM1αmt mice (black circles) as a function of stimulus frequency. F, Averaged phases (mean ± SD) of the fundamental's amplitude of the photopic flicker ERG of wild-type (white squares) and RIM1αmt mice (black circles) as a function of stimulus frequency. A–F, Statistical differences are indicated by asterisks; *p < 0.05. For detailed statistics, see Figures 3-1, 3-2, and 3-3, respectively.

