Figure 4.

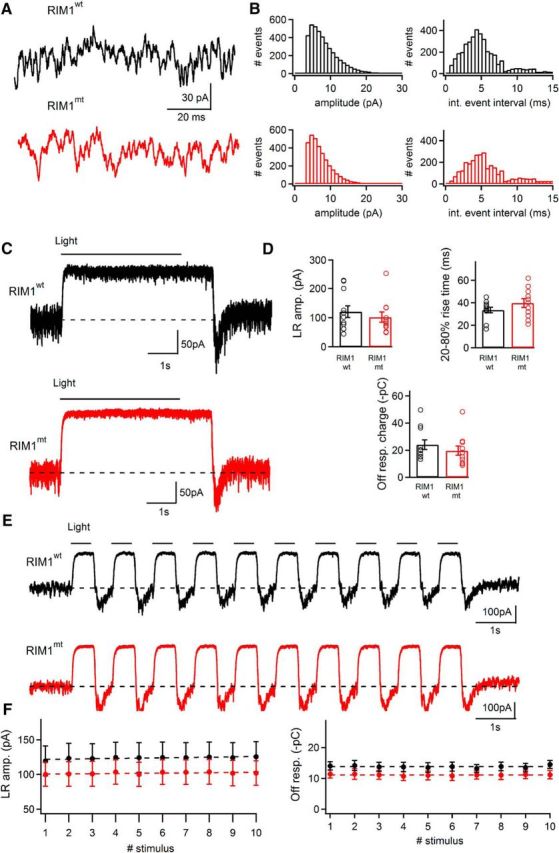
Tonic synaptic activity and light and dark responses in horizontal cells of RIM1αwt and RIM1αmt mice. A, B, Spontaneous events recorded at −60 mV holding potential from a horizontal cell body in a horizontal slice preparation of a RIM1αwt (black trace) and a RIM1αmt (red trace) mouse retina. B, Amplitude histograms of tonic synaptic events as shown in A and B were constructed from RIM1αwt (black trace) and RIM1αmt (red trace) retina (bin width: 1 pA) and interevent interval histograms of EPSCs recorded from RIM1αwt (black trace) and RIM1αmt (red trace) retina (bin width: 0.5 ms). RIM1αmt showed no significant difference in the distribution of EPSC amplitudes (p = 0.67; Levene's test) and interevent intervals (p = 0.70; Mann–Whitney U test). C, Relatively dark-adapted horizontal slice from RIM1αwt (black trace) and RIM1αmt (red trace) retina stimulated with a 5 s full-field-light flash. Current changes in response to the light stimulus recorded from horizontal cell bodies at −60 mV holding potential. D, Light response amplitude, rise time, and charge transfer of off-light response values were not significantly different between the two genotypes (light response amplitude: p = 0.49; rise time: p = 0.21; charge values of off-light responses p = 0.37; unpaired t test). E, Horizontal slice from RIM1αwt (black trace) and RIM1αmt (red trace) retina stimulated with a 1 Hz (500 ms duration) full field light stimulus (10 stimuli). Current changes in response to the train recorded from horizontal cell bodies at −60 mV holding potential. F, Peak light responses and off responses did not show significant adaptation during the course of stimulation as determined by fitting a linear regression line to the data points. Slope values for peak light responses were 0.431 ± 0.113 and 0.275 ± 0.181 for RIM1αwt and RIM1αmt, respectively (p = 0.4752; unpaired t test). Slope values for corresponding off responses were 0.009 ± 0.032 and −0.013 ± 0.027 (p = 0.5982; unpaired t test). n = 11 cells from 3 animals/genotype.
