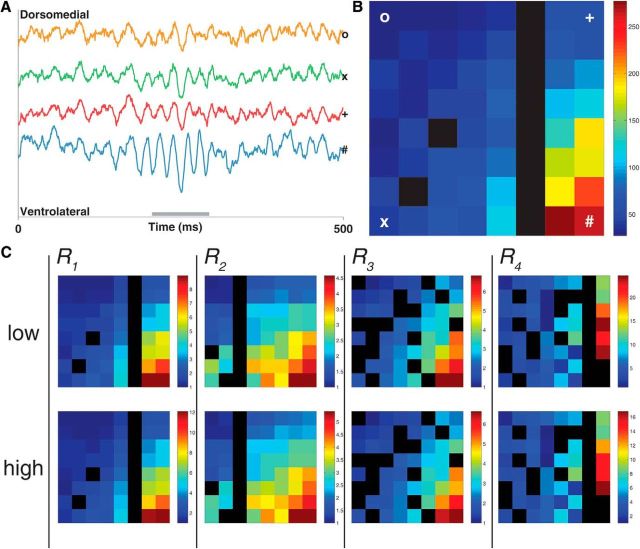
Figure 2.
Gamma-band LFP oscillations in the vStr form a dorsomedial to ventrolateral power gradient. A, Raw LFP traces from the recording electrodes at the dorsomedial (o), ventromedial (x), dorsolateral (*), and ventrolateral (#) points of the silicon probe for a representative low-gamma event. Gray bar spans the length of the gamma event (see Materials and Methods for details of gamma detection). B, Heat map showing gamma power (μV 2) across the recording array (64 sites, regularly spaced in an 8 × 8 grid spanning 1.4 mm2; see Fig. 1B for probe layout) during the same low-gamma event as seen in the raw traces. Gamma power is approximately five times greater in the ventrolateral site compared with the dorsomedial site. C, Average low- and high-gamma power across entire recording sessions (one each for subjects R1–R4; scale is normalized to the channel with the lowest power). Black spaces represent defective recording sites (see Materials and Methods for defective site criteria).

