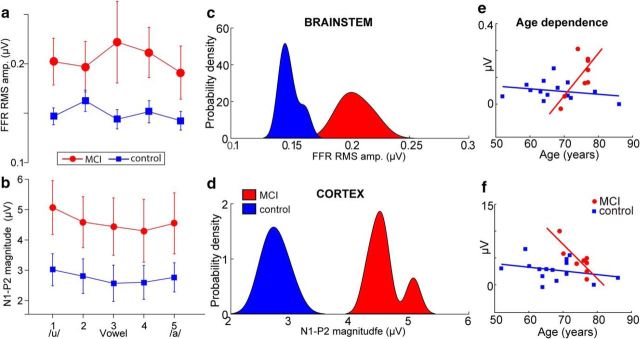
Figure 4.
Brainstem and cortical speech coding is overexaggerated in the MCI brain. a, b, RMS amplitudes of brainstem FFRs (a) and cortical N1–P2 (b) across the speech vowel continuum. Relative to controls, MCI is marked by larger, more robust subcortical and cortical responsiveness to speech. c, d, Probability density functions for the distribution of neural measures (i.e., pooling across speech tokens) per group. Note that groups are linearly separable based on either their (passively evoked) brainstem or (actively evoked) cortical response to speech. e, f, Age dependence. Group differences diverge in brainstem (e), but converge in cortical responses (f) with advancing age. Error bars indicate ± 1 SEM.

