Figure 3.
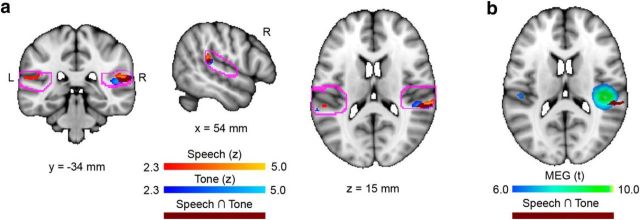
Areas within the auditory cortex that are sensitive to FFR–f0 strength. a, Coronal, sagittal, and horizontal brain slices showing statistical maps where BOLD signal was related to FFR–f0 strength for each stimulus set; greater FFR strength was related to higher BOLD signal in the right planum temporale (speech: orange; piano: blue). Overlapping regions are indicated in maroon. Bilateral ROIs encompassing the auditory cortex bilaterally are delineated in pink. b, Horizontal slice showing the location of FFR–f0 sensitive cortex in both conditions (maroon) in relation to the previous result of a right auditory cortex contribution to the FFR–f0 from MEG (Coffey et al., 2016b). Note that fMRI and MEG differ in their spatial resolution.

