Figure 5.
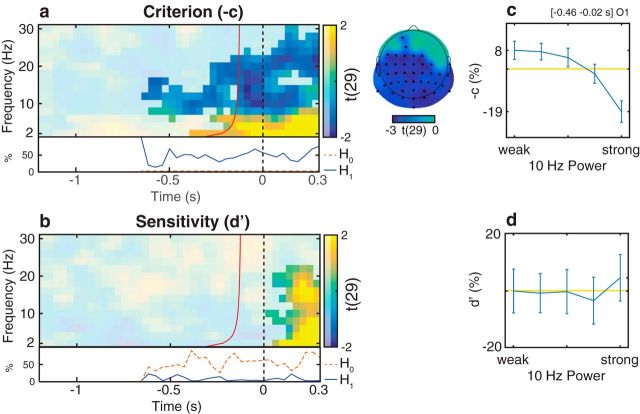
Relationship between oscillatory activity and distribution-dependent signal detection measures in Experiment 1. a, b, Group-level t statistics map of the difference in criterion (a) and sensitivity (b) between states of weak and strong oscillatory activity. During states of weak prestimulus oscillatory activity, stimulus presence is reported more often regardless of actual stimulus presence (higher −c: more liberal criterion). a, The map is averaged across cluster electrodes with significant prestimulus effects. The difference in sensitivity (d′) between states of weak and strong prestimulus oscillatory activity is not significant. b, The map is averaged across cluster electrodes with significant poststimulus effects. Time 0 s indicates stimulus onset in stimulus present trials, or the time when a stimulus would be presented in stimulus absent trials. The red line indicates the time points before which oscillatory activity is not contaminated by poststimulus activity. a, b, The maps are masked by a p value of 0.05 using two-sided cluster permutation testing. a, The topography shows the negative t statistics of the prestimulus −c cluster. Black dots represent prestimulus cluster electrodes. a, b, Bottom inset, Time course of the percentage of cluster t statistics in favor of an effect of power on −c/d′ (H1, solid line) or in favor of a null effect (H0, dashed line). b, The BF analysis shows that there is more evidence for H0 than for H1, indicating that prestimulus power had a null effect on d′. c, d, Group-average percentage change in −c (c) and d′ (d) in trials sorted from weak to strong oscillatory activity. A value of 0 indicates average performance across all bins (horizontal line). Error bars indicate SEM. c, d, The results comprise a time-frequency-electrode window with the most sustained prestimulus effect within the −c cluster.

