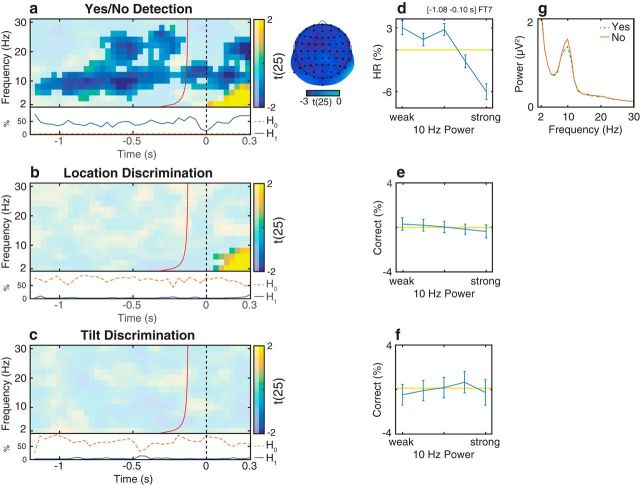
Figure 7.
Relationship between oscillatory activity and detection/discrimination in Experiment 2. a–c, Group-level t statistics map of the difference in hit rate (HR, a) and proportion of correct discrimination responses (b, c) between states of weak and strong oscillatory activity. The HR in the detection task increases during states of weak prestimulus oscillatory activity. a, The map is averaged across cluster electrodes with significant prestimulus effects. By contrast, there is no difference in proportion of correct responses between states of weak and strong prestimulus oscillatory activity. b, The map is averaged across cluster electrodes with significant poststimulus effects. c, The map is averaged across all electrodes. Time 0 s indicates stimulus onset. The red line indicates the time points before which oscillatory activity is not contaminated by poststimulus activity. a–c, The maps are masked by a p value of 0.05 using two-sided cluster permutation testing. a, The topography shows the negative t statistics of the prestimulus HR cluster. Black dots represent prestimulus cluster electrodes. a–c, Bottom inset, Time course of the percentage of cluster t statistics in favor of either an effect of power on detection/discrimination rates (H1, solid line) or a null effect (H0, dashed line). b, c, The BF analysis shows that there is more evidence for H0 than for H1, indicating that prestimulus power had a null effect on discrimination ability. d–f, Group-average percentage change in HR (d) and proportion of correct discrimination responses (e, f) in trials sorted from weak to strong prestimulus power. 0 indicates average performance across all bins (horizontal line). Error bars indicate SEM. g, Group-average FFT spectra computed for the prestimulus time window separately for “yes” (dashed line) and “no” reports (solid line) for detection trials. Compared with “no” reports (M), “yes” reports (H) are related to decreased prestimulus α power. d–g, The results comprise a time-frequency-electrode window with the most sustained prestimulus effect within the HR cluster.

