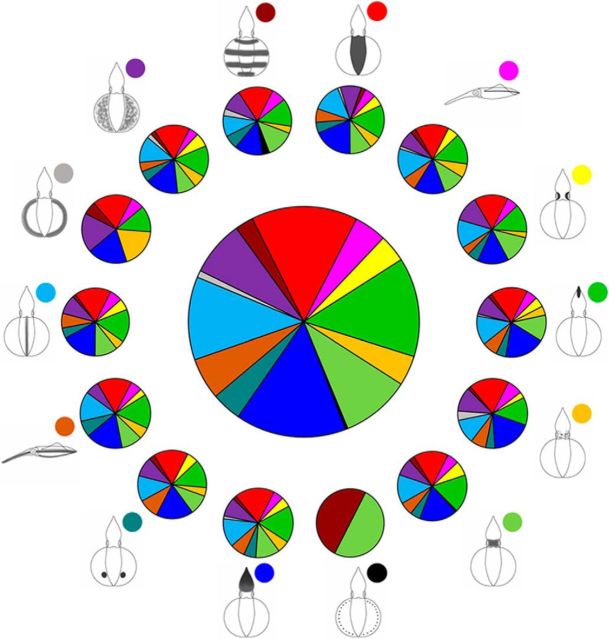
Figure 14.
Distribution of the evoked probabilities of the 14 body pattern components and their coexpression probabilities with other body pattern components. The central pie chart shows the distribution of evoked probabilities of the 14 body pattern components in the present study. The surrounding pie charts are the distribution of joint probabilities of each body pattern component with other 13 components.

