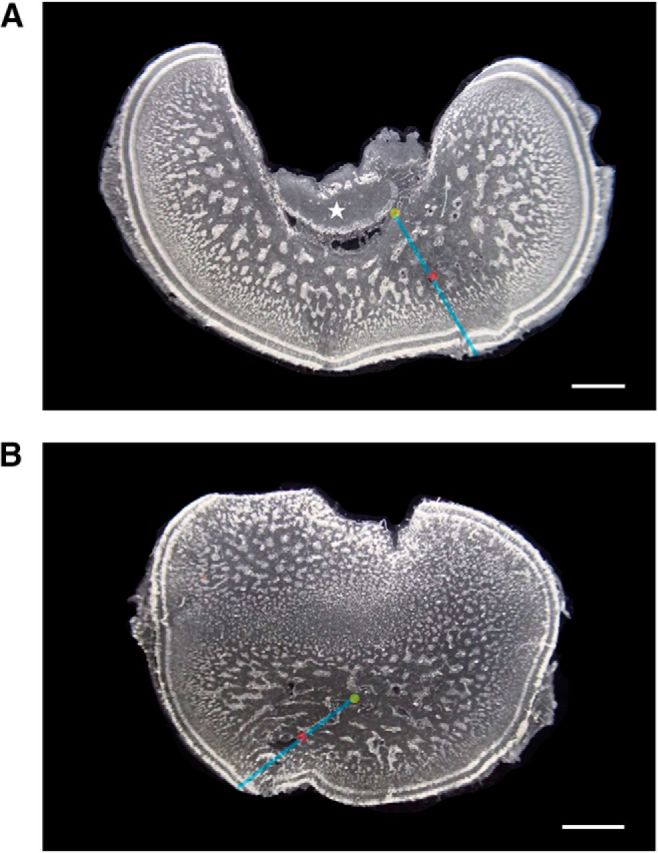
Figure 3.

Depth of the electrical stimulation site in the optic lobe. Two parasagittal sections of the optic lobe are shown. A, Optic lobe near the medial side showing the optic tract (asterisk). B, Optic lobe near the lateral side. Both sections show clearly the cortex and medulla of the optic lobe. To calculate the relative depth of the stimulation site (red dot), the center of the medulla (yellow dot) was determined either using the inner border of the optic lobe as in A or using the central mass of the optic lobe as in B. Blue line perpendicular to the cortex of the optic lobe indicates the total depth. Relative depth of the stimulation site is thus defined as travel distance of the electrode from the cortex divided by the total depth. Note that the optic lobe in B apparently has two zones of cell islands and this is a result of concave surface of the optic lobe at the lateral side. Scale bar, 1000 μm.
