Figure 4.

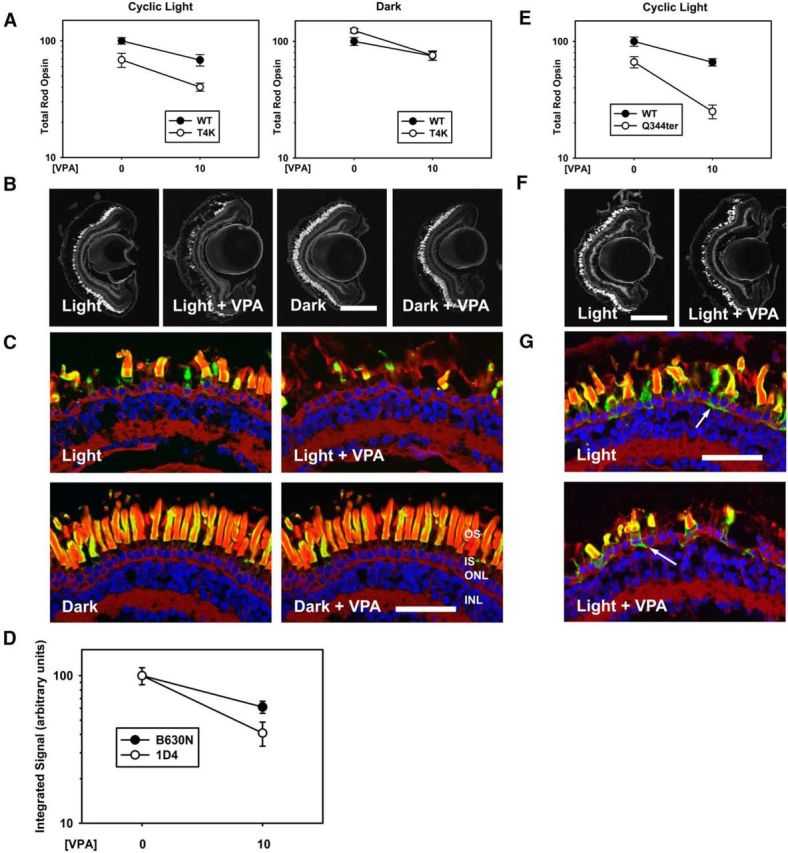
VPA has negative effects in a T4K rod opsin model and exacerbates RD in a Q344ter rod opsin model. A–D, Effects of VPA in a T4K rod opsin model. A, In cyclic light, effects of genotype and treatment were significant (pg = 5.8 × 10⁻⁵, pt = 1.2 × 10⁻⁴) and negative, but treatment did not modify the effect of genotype (pi = 0.45). In the dark, there was no effect of genotype (p = 0.111) and no interaction between treatment and genotype (p = 0.133). n = 6–11 animals per group. B, Representative low-magnification confocal micrographs of transgenic retinas expressing T4K rod opsin stained with WGA. C, Representative high-magnification confocal micrographs of transgenic retinas expressing T4K rod opsin stained with 2B2 anti-mammalian rhodopsin (green), WGA (red), and Hoechst dye (blue). VPA treatment did not alter T4K rod opsin distribution. D, Total rod opsin (B630N) and T4K rhodopsin (1D4) signals were quantified in dark reared animals. Two-way ANOVA analysis showed that VPA treatment reduced the antibody signals (p = 1.0 × 10⁻⁴), but the effect was not significantly different between total and transgenic rhodopsins (p = 0.099). n = 6–13 animals for each condition. E–G, Effects of VPA in a Q344ter rod opsin model. E, In cyclic light, the effects of genotype and treatment were significant (pg = 2 × 10⁻⁷, pt = 1 × 10⁻⁶) and treatment modified the effect of genotype significantly (pi = 0.016). n = 8–11 animals for each condition. F, Representative low-magnification confocal micrographs of transgenic retinas expressing Q344ter rod opsin stained with WGA. Scale bar, 200 μm. G, Representative high-magnification confocal micrographs of transgenic retinas expressing Q344ter rod opsin stained with 2B2 anti-mammalian rhodopsin (green), WGA (red), and Hoechst dye (blue). VPA treatment did not alter the distribution of Q344ter rod opsin. Scale bar, 50 μm. Error bars indicate SEM.
