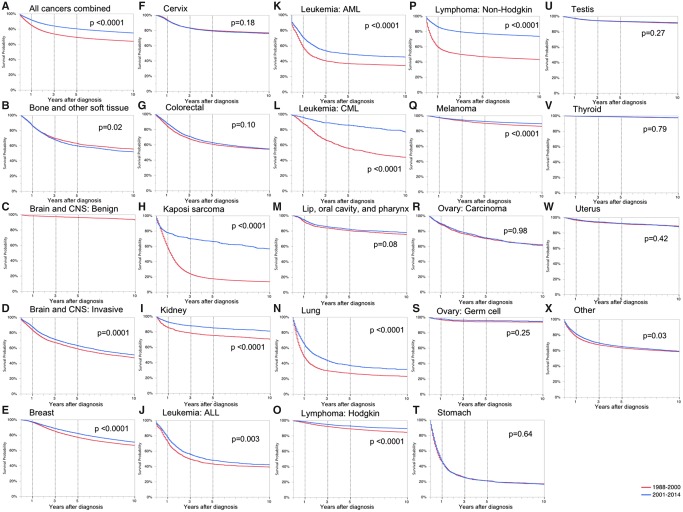
Figure 2.
Kaplan-Meier survival curves by time period for all cancers by site, adolescent and young adult, California, 1988–2000 and 2001–2014. Log-rank two-sided P values are reported. A) All cancers combined; B) bone and other soft tissue; C) brain and CNS: benign; D) brain and CNS: invasive; E) breast; F) cervix; G) colorectal; H) Kaposi sarcoma; I) kidney; J) leukemia: ALL; K) leukemia: AML; L) leukemia: CML; M) lip, oral cavity, and pharynx; N) lung; O) lymphoma: Hodgkin; P) lymphoma: non-Hodgkin; Q) melanoma; R) ovary: carcinoma; S) ovary: germ cell; T) stomach; U) testis; V) thyroid; W) uterus; X) other. Other indicates all noncategorized invasive cancers and benign intracranial tumors. See Supplementary Table 2 (available online) for cancer sites included in other. ALL = acute lymphocytic leukemia; AML = acute myeloid leukemia; AYA = adolescent and young adult; CML = chronic myeloid leukemia; CNS = central nervous system.

