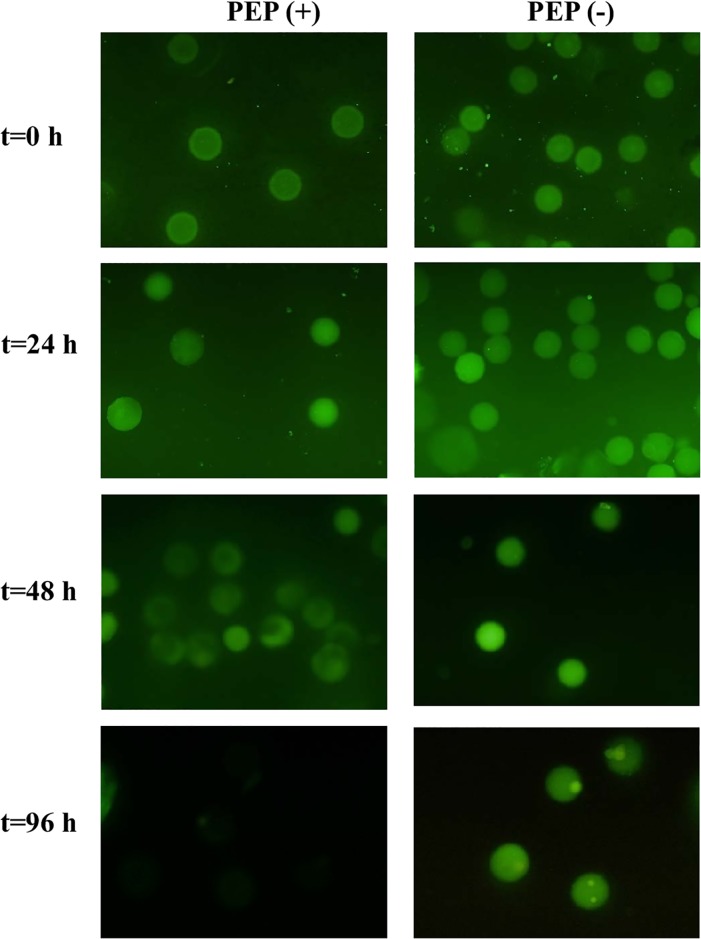
Fig 2. Detection of glutenase activity in microencapsulated bacteria.
Fluorescence intensity of each individual alginate particle was detected and quantified with the moAb G12-FITC at different incubation times. Micrographs corresponding to the most representative samples are shown. PEP (+) show the fluorescence of microencapsulated bacteria hydrolyzing the gliadin, and PEP (-), containing microparticles without bacteria.

