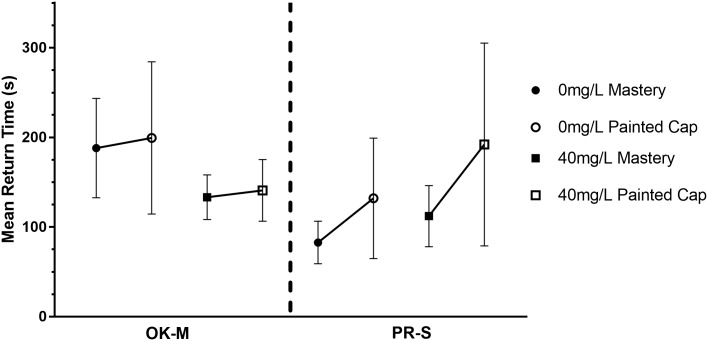
Fig 4. Mean time to exit the platform and return for another visit by subspecies and concentration.
For each exposure concentration the right-most point is the mean before exposure (4–8 platform visits) and the second point of the mean after exposure (24 total platform visits). Error bars represent the standard error of the mean.

