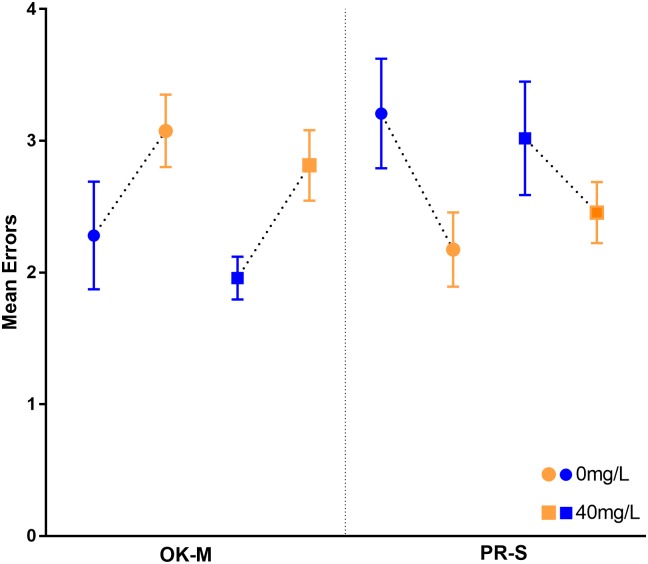
Fig 5. The mean number of errors by exposure concentration and subspecies.
Errors were defined as touching the cap covering water. The presented data includes interactions before and after the reward was consumed. Blue points represent when blue caps covered the reward and yellow points represent when yellow covered the reward.

