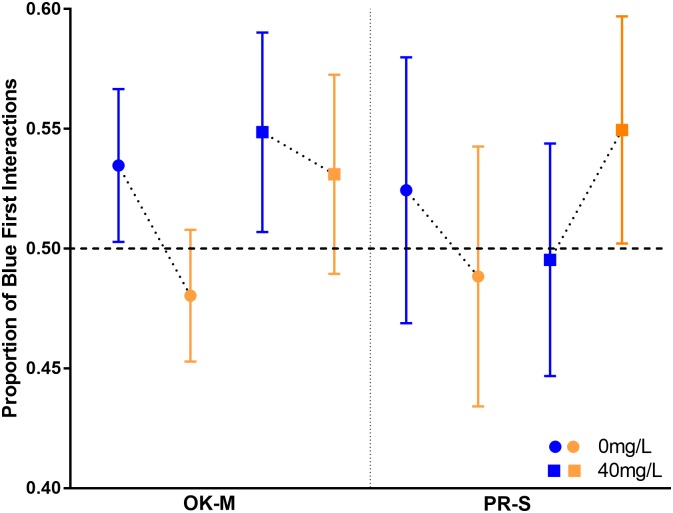
Fig 6. Proportion of blue first interactions by subspecies and concentration.
Blue points represent when blue caps covered the reward and yellow points represent when yellow covered the reward. The horizontal line is at chance (50% likelihood of choosing either color), there was no significant variation from this point. Error bars represent the standard error of the mean.

