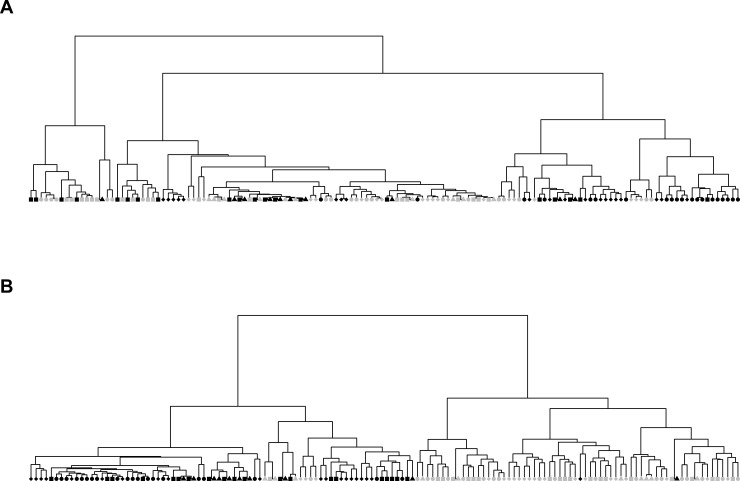
Fig 3. Results based on the first workflow.
Dark circles: MSSA samples, grey circles: MRSA samples. Nodes with the same shape stand for the technical replicates. (A): Based on feature matrix extracted from MALDIquant, using correlation based distance metric in HC plot. (B): optimized binary matrix output from BinDA (using only top 100 features).

