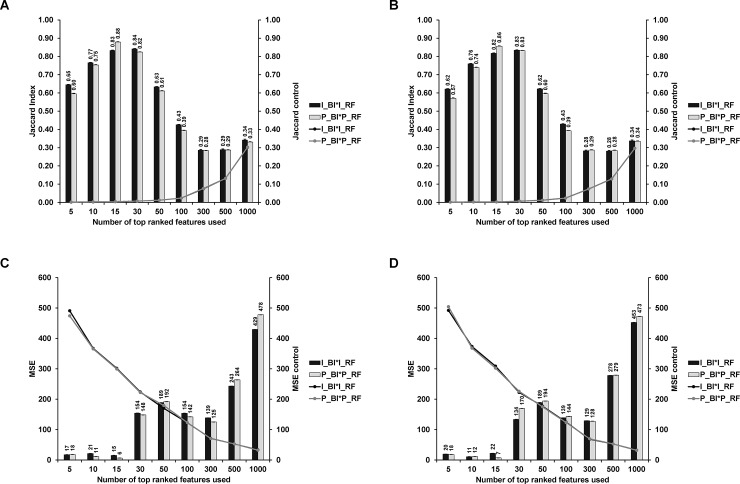
Fig 5.
Comparisons of top ranked features using both Jaccard Index (A-B) and MSE (C-D). The error bars for the points on the solid lines (control) were obtained by mean±sd/√1000, but they are two small to be observed. Also note that for A and B, the line plots for the two workflows are very close to each other. Training and testing datasets were created by splitting either biological replicates (A, C) or samples (B, D). Top ranked features were compared between I_BI and I_RF (I_BI*I_RF) or P_BI and P_RF (P_BI*P_RF). Solid bars were calculated by either mean±sd/√32 (A, C) or mean±sd/√80 (B, D).

