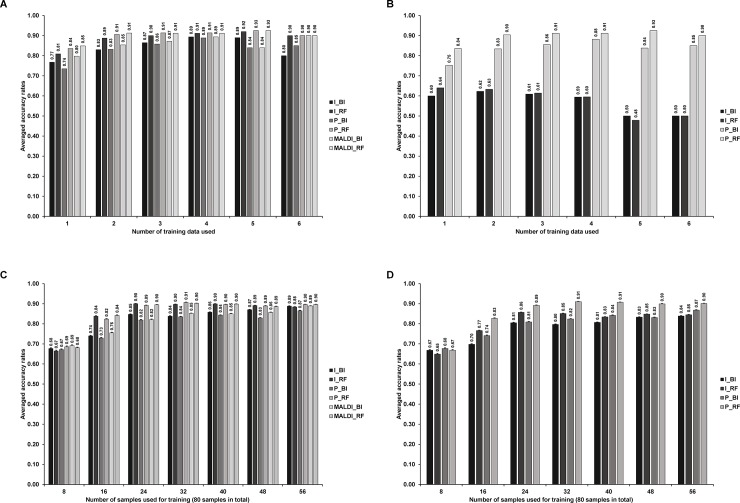
Fig 6.
Classification accuracy rates as a function of the number of datasets (A-B) or samples (C-D) used in training procedure: (A): One of seven datasets was tested, while a subset of the rest datasets were for training. We also made sure that the technical replicate of testing data was not included in training. (B): Similar in (A), but we do not align testing data according to the reference peaks extracted from training data. (C) 24 out of 80 samples were used for testing, where the 80 samples come from the 4 biological replicates. The way we split samples made sure that the biological replicates of the same sample did not appear in both training and testing data. (D) Procedure similar to the panel (A), but here we do not align testing data according to the reference peaks extracted from training data. Error bars in panels (C-D) were calculated by mean±sd/√40. Error bars were not shown in panels (A-B) because different number of testings were performed in each case.

