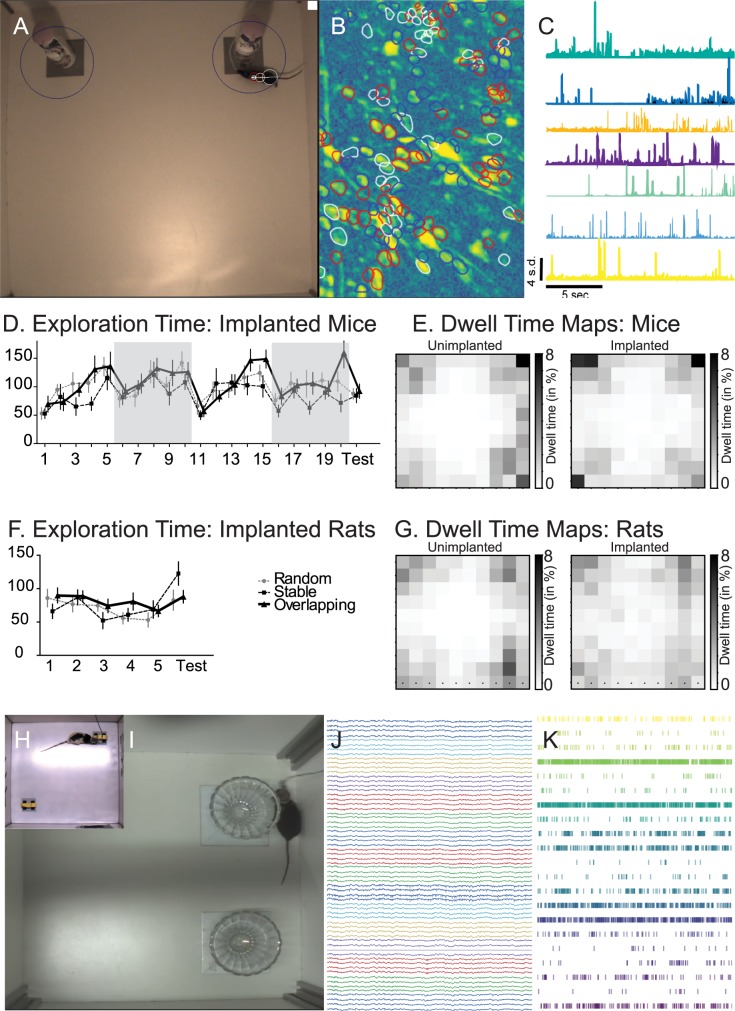
Fig 5. Object space task: Calcium imaging and electrophysiology.
Example of a mouse running the object space task with calcium imaging (Inscopix, A), example raw signal (B), and extracted calcium transients (C). D shows exploration times in implanted mice (Data in S6 Data) and E dwell time maps for a random set of 20 trial of unimplanted (left) and implanted (right) mice. F shows exploration times and G dwell times maps for rats (Data in S7 Data; G again random sample of 20 videos). Example of a rat (H) and mouse (I) running the object space task with electrophysiological implants, example raw LFP signal (J) and extracted unit activity (K). Further speed and position analysis of implanted and unimplanted animals: mouse implanted (speed 5.559 cm/s ± 2.323 cm/s, at border: 75.1% of frames, at center: 24.9% of frames. Data in S10 Data), mouse unimplanted (speed 7.497 cm/s ± 4.314cm/s, at border: 75.3% of frames, at center: 24.7% of frames. Data in S11 Data), rat implanted (speed 5.689 cm/s± 1.623 cm/s, at border: 69.1% of frames, at center: 30.9% of frames, Data in S12 Data), and rat unimplanted (speed 7.909 cm/s ± 3.629 cm/s, at border: 79.8% of frames, at center: 20.2% of frames. Data in S13 Data). n = 3 for rats, n = 6 for mice, random 10 trials were chosen for analysis.

