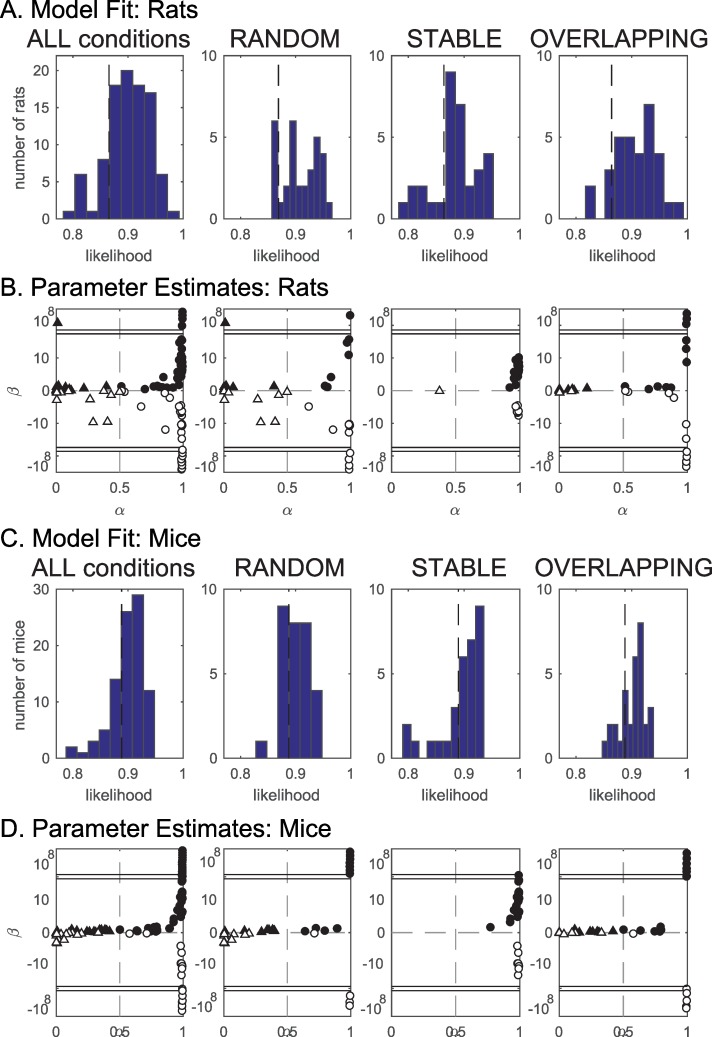
Fig 6. Fit of computational model on data.
The optimized model fits the behavior of rats (A–B) and mice (C–D) better than chance. A. Histogram of goodness of fit (model likelihood) for all rats, averaged across conditions (first panel) and in the 3 experimental conditions separately. The vertical dashed line denotes average chance level. Note, however, that for each individual session, the model fits better than that expected by chance for that specific session. B. Optimal values for the model parameters α and β rat experiments. Each symbol corresponds to 1 experiment test (1 animal, 1 condition, conditions may be repeated across animals). For overlapping, the model requires an α≪1 in order to reliably accumulate evidence over a large number of trials. In contrast, for stable high values of α were obtained. The value of α for stable is nevertheless to a large extent immaterial for task performance because recent and remote trials contain the same information (the object configuration does not change). Double horizontal lines indicate y-axis discontinuity (to accommodate for outliers) C. and D. same as A and B for mice. D. Horizontal dashed lines indicate |β|≫20 in B and |β|≫10 in D. Data in S8 Data.

