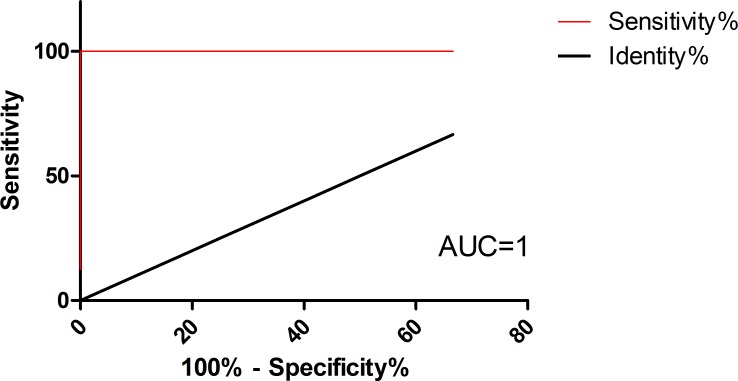
Fig 2. ROC curve analysis.
Area under ROC curves (AUC) analysis were performed with Ct values of the Giardia miR-5 as predictors for disease category (infected = duodenum positive /control = gastric) as response variable (red lines). P value = 0.0002. ROC curve was fitted using GraphPad Prism version 5.00 for Windows. The diagonal black line reflects the performance of a diagnostic test that is no better than chance level.

