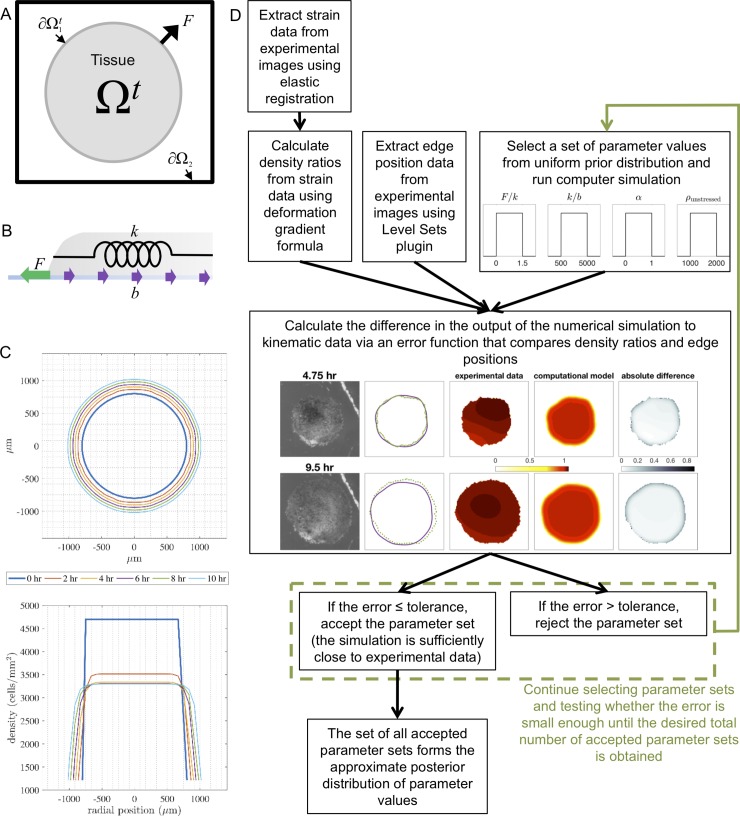
Fig 2. Schematics of the numerical simulations and approximate Bayesian computation rejection method.
(A) Computational domain of the moving boundary initial value problem as if looking at the explant from above. The tissue is located in the shaded region (Ωt), the tissue boundary is denoted by ∂Ω1t, the edge of the computational domain is denoted by ∂Ω2, and F is the net external force per unit length at the tissue boundary that develops as a result of lamellipodia formation. (B) Schematic of a cross-section of the explant during spreading and the forces governing its movement. The green arrow represents the lamellipodia force F, the purple arrows represent the adhesion force b, and the spring represents the residual stretching modulus of the tissue k. (C) Toy simulation showing the output of the boundary locations (as viewed from above) and density profiles (as a cross-section through the horizontal axis) every 2 hours over 10 hours. The fixed grid used is shown as gray dashed lines. (D) Flow chart of the approximate Bayesian computation (ABC) rejection algorithm implemented for parameter estimation.

