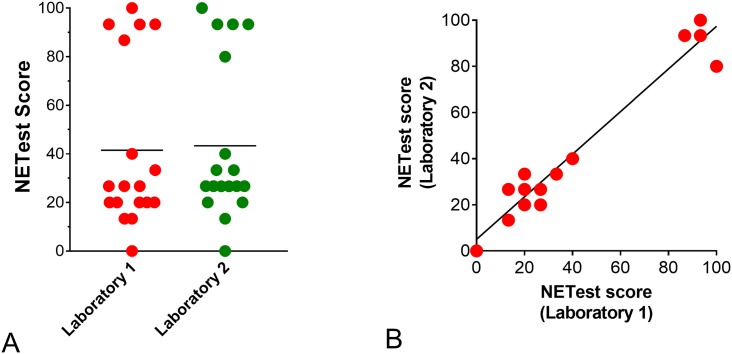
Fig 5. Robustness of PSP to attain a NETest result in Sample Set III (n = 18).
5A. Individual scores from the 18 samples in each of the two laboratories. Scores were not significantly different. Horizontal line = mean value for each group. 5B. Individual NETest correlations between the two laboratories (matched samples: n = 18). The correlation (Pearson r) was 0.967 (p<0.0001).

