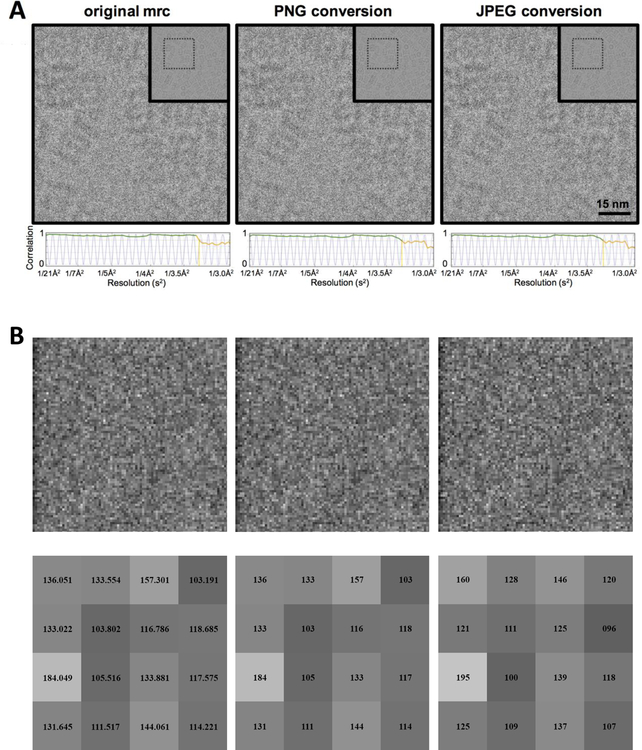
Figure 1. Effect of data reduction treatment on images A.
A. Comparison between original MRC file, PNG lossless compressed image, and JPEG075 lossy compressed image. Inset: The original micrograph indicating region of interest. Below each micrograph is a 1D plot of the CTF estimated by CTFFind4; the green curve tracks the 80% confidence level of the estimation, which is at 3.18Å for each of the images shown.
B. Top: Zoomed in region of the images in 1A. Bottom: 4×4 selected pixel sub region area showing the pixel values before and after conversion.
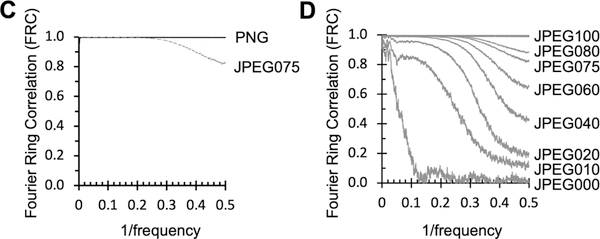
C. Fourier Ring Correlation of PNG to MRC (solid black line) and JPEG to MRC (dashed grey line) of images shown in 1A.
D. Four Ring Correlations comparing MRC images to various JPEG compression formats.


