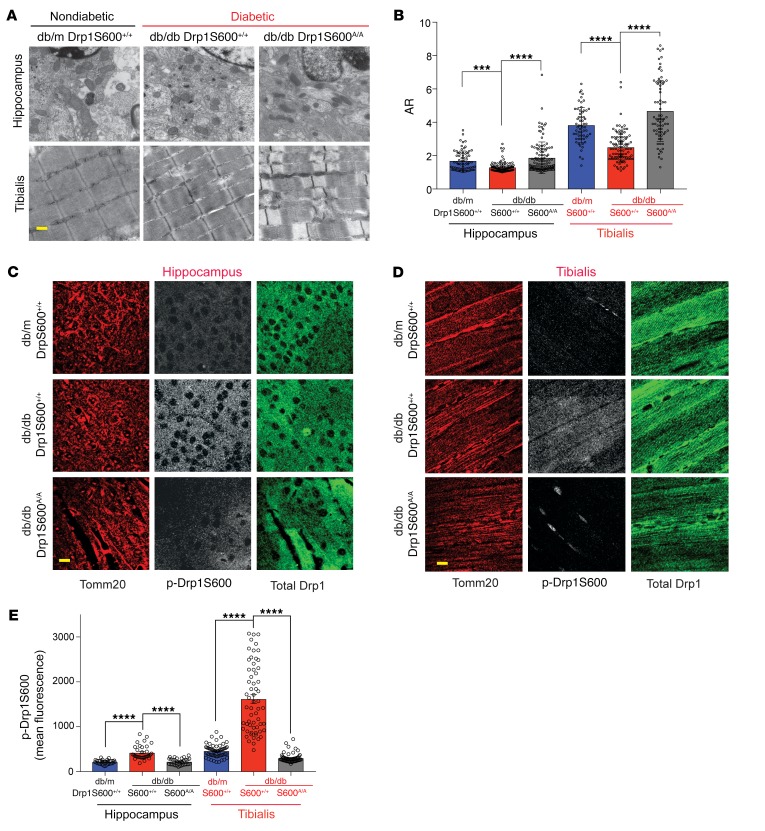
Figure 5. Tissue-independent effect of Drp1S600A on mitochondrial fission in diabetic mice.
Hippocampal neurons and TA muscle cells from mice of different groups were fixed for histology and TEM analysis. (A) Representative TEM images. Scale bar: 500 nm. (B) Quantification of mitochondrial morphology from TEM images. (C) Immunofluorescence staining of paraffin-embedded hippocampal tissue. Left panels show mitochondria stained for Tomm20 (red). Middle panels show gray-scale images of p-Drp1S600 staining. All gray-scale images were captured with identical confocal settings, and images were manipulated simultaneously and equally for each tissue. Right panels show total Drp1 staining (green). Scale bar: 25 μm. (D) Immunofluorescence staining of TA muscle cells as performed in C. Scale bar: 25 μm. (E) Quantification of p-Drp1S600 staining intensity from sections of hippocampus and TA muscle immunostained with anti–p-Drp1S600. Representative images are from a sampling of 3 animals. ***P < 0.001 and ****P < 0.0001, by 1-way ANOVA with Tukey’s multiple comparisons test. Results are presented as the mean ± standard error of the mean (n = 3–5/group).

