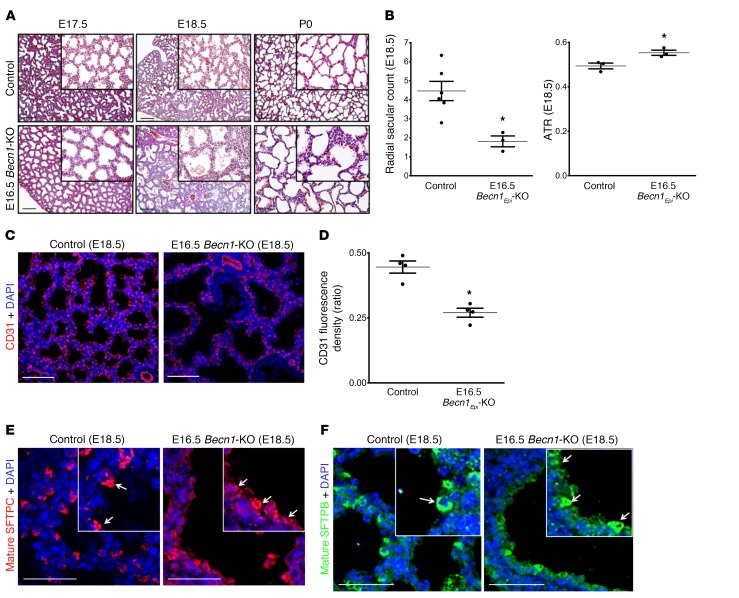
Figure 11. Pulmonary phenotype following deletion of epithelial Becn1 at canalicular/saccular stages.
(A) Representative H&E-stained images of lungs from littermate control (WT) and E16.5 Becn1Epi-KO mice at E17.5, E18.5, and immediately after birth (P0). Scale bars: 100 μm; original magnification, ×20 (insets). (B) Graph shows the radial saccular count and the ATR for littermate control and E16.5 Becn1Epi-KO mice at E18.5. Data represent the mean ± SEM (n = 5 separate lungs). *P < 0.05 versus WT control, by Student’s t test. (C) Confocal IF microscopic images of embryonic lungs (E18.5) stained for the endothelial cell marker CD31 (red). Nuclei were stained with DAPI (blue). Scale bars: 50 μm. (D) Quantification of the CD31/DAPI fluorescence ratio in E18.5 lung tissue from control (WT) and E16.5 Becn1Epi-KO embryos. Results are shown as the mean ± SEM (n = 3 separate lungs). *P < 0.05 versus WT control, by Student’s t test. (E and F) Representative confocal IF microscopic images of E18.5 lung tissue sections from E16.5 Becn1Epi-KO and littermate control mice stained for mature SFTPC (E, red) and SFTPB (F, green). Nuclei were stained with DAPI. The white arrows in the insets point to cuboidal alveolar type II epithelial cells. Scale bars: 25 μm; original magnification, x40 (insets).

